LinkedIn Statistics: Members, Users and Usage
LinkedIn statistics from LinkedIn's own sources: 1.4 billion members, regional counts, activity per minute and growth rates, with the date printed.

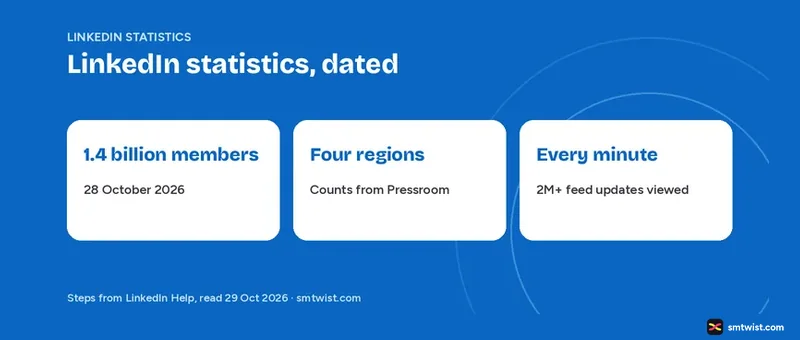
LinkedIn spreads its numbers across the Pressroom, the About site and quarterly results posts, and some show a date while others do not. This guide on LinkedIn statistics gathers the figures LinkedIn printed, reads every date as printed and flags where two sources disagree. Membership stands at more than 1.4 billion, and every figure comes from a LinkedIn source we opened on 29 October 2026.
LinkedIn Statistics on Members by Date
Member counts appear in several places on LinkedIn, and the answer changes with the date. Three Pressroom posts and two undated sources give five readings.
| Date | Members | Source |
|---|---|---|
| 30 July 2025 | About 1.2 billion | Q4 FY25 results post |
| 30 April 2026 | More than 1.3 billion | Q3 FY26 results post |
| 28 October 2026 | More than 1.4 billion | Q1 FY27 results post |
| No date | More than 1.4 billion | Pressroom About Us |
| No date | More than 1 billion | About LinkedIn site |
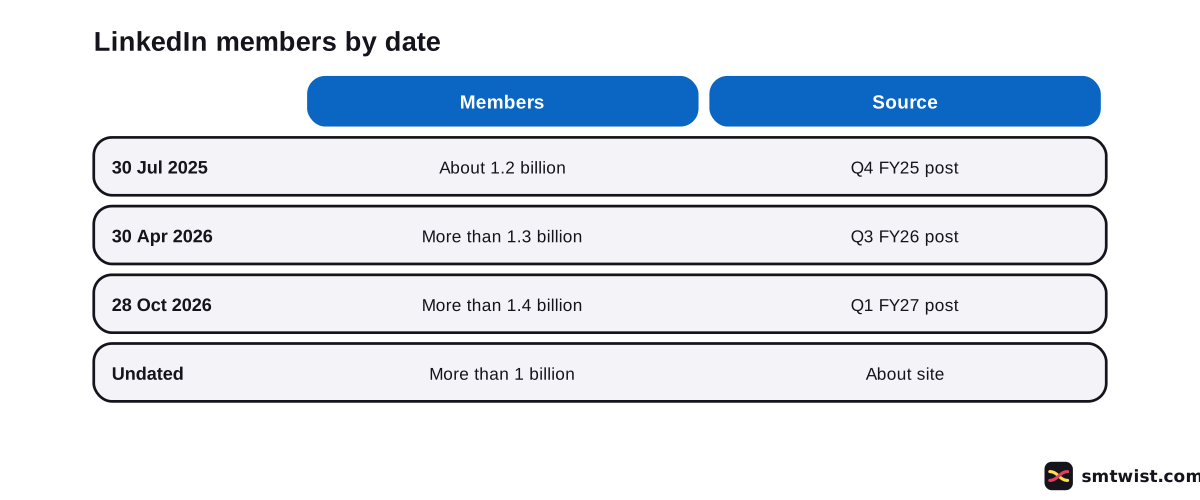
Use the 28 October 2026 reading when you need one current number in LinkedIn statistics. LinkedIn prints no date next to the About site line.
How Many LinkedIn Members are There by Region?
Membership splits into four regions in the Pressroom About Us table. The table prints no date. Read the counts as the Pressroom's table on 29 October 2026.
| Region | Members |
|---|---|
| Europe, Middle East and Africa | 450M+ |
| Asia Pacific | 427M+ |
| North America (United States and Canada) | 296M+ |
| South and Central America | 233M+ |
Our arithmetic puts the four figures at 1,406 million, in line with the 1.4 billion headline on the same table. LinkedIn defines Asia Pacific as India, China, Japan, Southeast Asia and Oceania. Mexico and the Caribbean sit under South and Central America.
Regional LinkedIn statistics help you judge where an audience lives. LinkedIn does not say in this table how it assigns a member to a region. Treat the split as a broad guide.
What Happens Every Minute on LinkedIn?
Five activity figures sit in the same Pressroom table, and they are the quickest LinkedIn statistics to quote for scale. LinkedIn prints no date for them.
- 110 people add a new role to their profile.
- About 9K job applications are submitted.
- 2M+ Feed updates are viewed.
- 19K+ connections are made.
- About 119 hours of learning content are consumed.
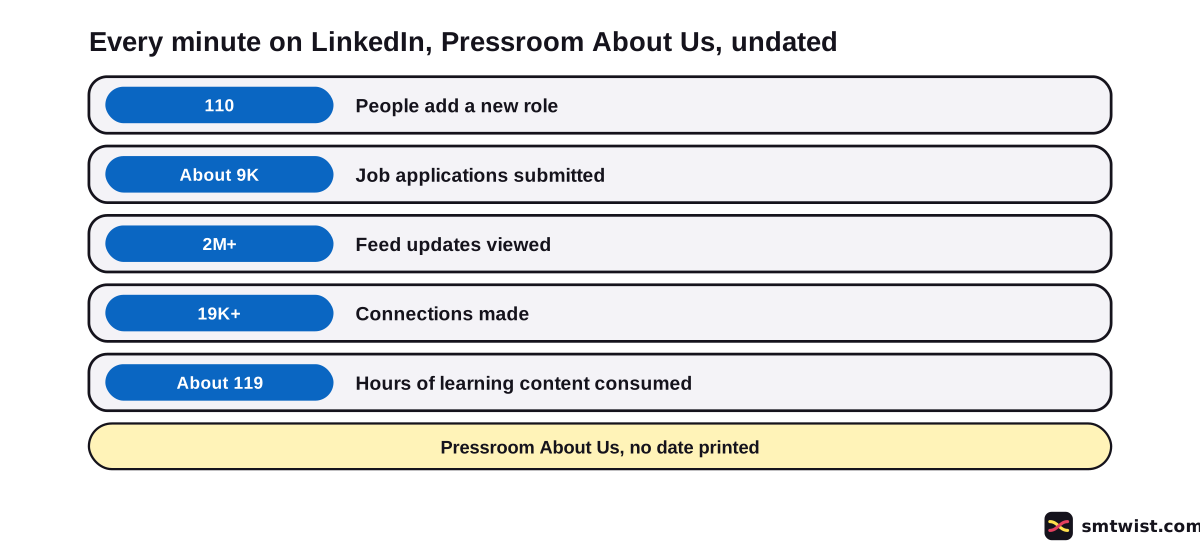
Of all the LinkedIn statistics in the Pressroom, this table is the one that counts actions and not members. Activity counts are not user counts. LinkedIn does not say how many distinct members sit behind them, and it prints no monthly or daily active member figure in the sources we read.
LinkedIn Usage Statistics From Earnings Posts
After every Microsoft earnings report, LinkedIn publishes a short results post with fresh LinkedIn statistics. Three of them give dated usage and growth figures. These LinkedIn usage statistics are mainly percentages and not totals.
| Date | Period | What LinkedIn printed |
|---|---|---|
| 30 July 2025 | Q4 FY25 | Comments up over 30 percent and video uploads up over 20 percent this year. Revenue up 9 percent in Q4 (8 percent in constant currency) |
| 30 April 2026 | Q3 FY26 | Original posts up 14 percent and knowledge-oriented comments up 11 percent year over year. Revenue up 12 percent (9 percent in C$ as the post prints it) |
| 28 October 2026 | Q1 FY27 | Feed content views up more than 16 percent and time spent engaging up over 15 percent year over year |
The 28 October 2026 post adds three figures for advertisers and creators. Paid video grew 25 percent year over year, creator-led ads grew 63 percent and established creators posting daily grew 13 percent, about 6x faster than the broader creator base. Paid subscriptions to premium company profiles rose 121 percent year over year.
Hiring figures moved fast too. In July 2025 LinkedIn said about one million members used its AI-powered job search daily. On 28 October 2026 it said more than 10 million, and it counted over 25,000 customers on its agentic hiring solutions.
LinkedIn Statistics on Companies, Schools and Skills
Company LinkedIn statistics start with the About Us table, which counts 71M companies, 145K+ schools and 42K+ skills. The LinkedIn Pulse announcement of 27 October 2026 repeats 71 million companies and 42,000 skills, and says LinkedIn draws on 1.4 billion members. LinkedIn Pulse is the new name for the LinkedIn Economic Graph site.
The skill figures have their own date. Only 1.2 percent of members list an AI skill today, says the same announcement. It also says members who list AI literacy skills are 78 percent more likely to get hired and 11 percent more likely to be promoted than members who do not.
Where do Two LinkedIn Sources Disagree?
Four numbers in LinkedIn statistics differ between sources. We give both sides and do not pick one.
- Members. The About site says more than 1 billion with no date. The Pressroom says more than 1.4 billion on 28 October 2026.
- Years of growth. The 30 July 2025 post reports four consecutive years of double-digit member growth. The undated About Us table says 5+ years.
- Schools. The About Us table says 145K+. The Pressroom front feature of 27 October 2026 says 144K.
- Offices. One block of About Us says more than 36 cities and another block says more than 30 cities.
The first item matters most for anyone quoting LinkedIn statistics.
Quote LinkedIn user statistics in three parts, which are the number, the date and the source name. Say Pressroom or About site rather than LinkedIn alone. Readers then see which of the two sources you used.
The undated more than 1 billion is old wording. Pair it with a dated figure when you write it down.
How to See Your Own LinkedIn Statistics
Platform totals do not tell you how your posts perform. Your own LinkedIn statistics sit in a different place. LinkedIn Help says every member has combined post analytics in Analytics & tools, available on desktop only and rolling out gradually.
You pick a range of 7 to 365 days, switch between impressions and engagements and export to an .XLSX file. Engagements cover reactions, comments, saves, sends and reposts. LinkedIn Help calls impressions an estimate and not precise, and the impressions guide explains the count.
For the full set of profile and post views, see how to see your LinkedIn analytics.
What is Still Unconfirmed?
Nothing here ran on a live account, which sets the label at Checked. The Pressroom About Us table has no date, and its 1.4B members, 16 percent content view growth and 25 percent paid video growth match the 28 October 2026 post. We infer a recent update.
The July 2026 quarterly post did not load, which leaves the table without a Q4 FY26 row. LinkedIn prints no daily or monthly active member count in the LinkedIn statistics we read, and we use no third party estimate.
Where This Guide Fits
Platform totals belong to the LinkedIn Analytics and Growth group inside the LinkedIn hub. To turn the follower numbers into a plan, read how to get more followers on LinkedIn.
Companies that want these LinkedIn statistics in context can start with LinkedIn marketing. The Checked label on this guide is defined in the editorial policy.
Sources
- LinkedIn Pressroom: About Us statistics, read 29 October 2026, members, regional counts, activity per minute, companies, schools and skills. No date is printed.
- About LinkedIn, read 29 October 2026, the more than 1 billion members line, countries, launch date and the 2016 acquisition. No date is printed.
- LinkedIn Pressroom: Q1 Earnings and Business Results, published 28 October 2026, read 29 October 2026, members and usage growth rates.
- LinkedIn Pressroom: Q3 Earnings Results, published 30 April 2026, read 29 October 2026, members, revenue and posting growth.
- LinkedIn Pressroom: Q4 FY25 Earnings Results, published 30 July 2025, read 29 October 2026, members, comments and video growth.
- LinkedIn Pressroom: data shows where opportunity is emerging, published 27 October 2026, read 29 October 2026, LinkedIn Pulse and the AI skill share.
- LinkedIn Help: Combined post analytics, read 29 October 2026, where your own post statistics live.
This guide is labelled Checked. Every figure was compared with the seven LinkedIn sources above. No test ran on a live account. How we label guides explains the three labels.
FAQ
How many members does LinkedIn have?
More than 1.4 billion, according to LinkedIn's Q1 FY27 results post of 28 October 2026. The About LinkedIn site still says more than 1 billion with no date printed.
How many people use LinkedIn every day?
LinkedIn does not print a daily user count in the Pressroom posts we read. It prints activity instead, with 2M+ Feed updates viewed and 19K+ connections made every minute in an undated table.
Which region has the most LinkedIn members?
Europe, Middle East and Africa with 450M+ members, says the Pressroom About Us table. Asia Pacific follows with 427M+, then North America with 296M+ and South and Central America with 233M+.
How many countries is LinkedIn in?
More than 200 countries and territories, says the About LinkedIn site. The Pressroom lists 36 languages for the platform.
When was LinkedIn launched?
On 5 May 2003, says the About LinkedIn site. The company began in Reid Hoffman's living room in 2002, and Microsoft completed its acquisition in December 2016.
Is LinkedIn growing or shrinking?
Growing, by LinkedIn's own figures. Members rose from about 1.2 billion on 30 July 2025 to more than 1.4 billion on 28 October 2026, and Feed content views rose more than 16 percent year over year.
Where can I see my own LinkedIn stats?
Open Analytics & tools. LinkedIn Help says combined post analytics shows impressions and engagements for a range of 7 to 365 days and exports to an .XLSX file.
What share of LinkedIn members list an AI skill?
1.2 percent, according to the LinkedIn Pulse announcement of 27 October 2026. The same post says members who list AI literacy skills are 78 percent more likely to get hired.
 Editor
Written by
Namrata Arora
Namrata Arora is a social media expert with two years of hands on experience on Instagram, Facebook and other platforms. She writes the how to guides on Social Media Twist and tries the steps on a real account for every guide marked Tested.
- Marks every guide Tested or Checked
- Writes about Instagram, Facebook, TikTok
- 43 guides on SMTwist
Guest posts are edited by SMTwist before they go live. Paid or affiliate links are labelled and carry rel="sponsored".